Project - Azure Honeynet & SOC (w/ Real-World Cyber Attacks)
Introduction and Purpose
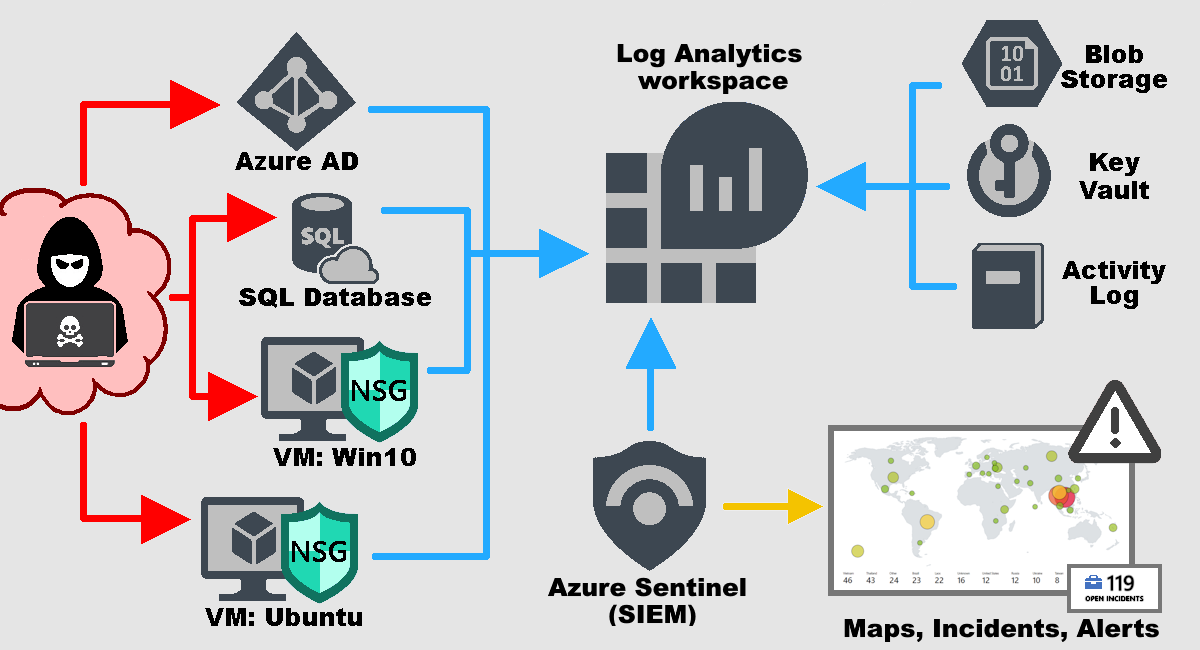
In this project, I constructed a small-scale honeynet and Security Operations Center (SOC) within Azure. The project aimed to compare metrics ‘Before’ and ‘After’ hardening an insecure lab environment. To obtain these metrics, log sources from various resources were ingested into my log repository (Log Analytics Workspace). These log sources were then utilized by my SIEM (Microsoft Sentinel) to build attack maps, trigger alerts, and create incidents. Microsoft Sentinel measured the metrics of the insecure environment over a 24-hour period. Following this phase, security controls were implemented to harden this virtual lab environment. The metrics analyzed were:
- SecurityEvent (Windows event logs)
- Syslog (Linux event logs)
- SecurityAlert (Log Analytics alerts triggered)
- SecurityIncident (incidents created by Sentinel)
- AzureNetworkAnalytics_CL (malicious flows allowed into the honeynet)
After the implementation of security controls, another 24-hour metric measurement phase was conducted, and the results obtained from these endeavors are presented below. The comparative analysis of metrics before and after the hardening process showcased a significant reduction in security incidents and a notable enhancement in its overall security posture.
Technologies, Azure Components, and Regulations Employed
- Azure Virtual Network (VNet)
- Azure Network Security Group (NSG)
- Azure Active Directory (renamed to Entra ID)
- Virtual Machines → 2 Windows, 1 Linux
- Microsoft SQL Server
- SQL Server Management Studio (SSMS)
- Log Analytics Workspace → with Kusto Query Language (KQL) queries
- Azure Key Vault → for secure secrets management
- Azure Storage Account → for data storage
- Microsoft Sentinel → Security Information and Event Management (SIEM)
- Microsoft Defender for the Cloud → protection of cloud resources
- Windows Remote Desktop → for remote access
- Command Line Interface (CLI) → for system management
- PowerShell → for automation and configuration management
- NIST SP 800-53 r5 → for security controls
- NIST SP 800-61 r2 → for incident handling guidance
Architecture ‘Before’ Hardening the Environment

To gather metrics for the insecure environment, all resources were initially deployed with their endpoints exposed to the public internet to encourage malicious traffic. Additionally, I disabled the built-in VM firewalls, and configured the VMs’ Network Security Groups (NSGs) as open, allowing unrestricted traffic. Following the configuration of log collection and the establishment of security metrics, I conducted a 24-hour observation of the ‘Before’ environment.
Metrics ‘Before’ Hardening
The following table shows the 24-hour metrics generated before hardening the environment: 11/20/2023, 12:05:40 PM → 11/21/2023, 12:05:40 PM
| Metric | Count |
|---|---|
| SecurityEvents (Windows VMs): | 22,540 |
| Syslog (Linux VM): | 998 |
| SecurityAlert (Microsoft Defender for Cloud): | 7 |
| SecurityIncident (Sentinel Incidents): | 152 |
| NSG Inbound Malicious Flows Allowed: | 2,385 |
Attack Maps ‘Before’ Hardening
NSG Allowed Malicious Inbound Flows
")
Linux SSH Authentication Failures
")
Windows RDP/SMB Authentication Failures
")
MS SQL Server Authentication Failures
")
Hardening the Environment
Now that I’ve gathered ‘Before’ metrics for my insecure lab environment, I proceeded to take steps to enhance its security posture. These hardening tactics included:
- Network Security Groups (NSGs): Strengthened by blocking all inbound and outbound traffic, except for designated public IP addresses needed access to the VMs. This ensured that only authorized traffic from trusted sources could access the VMs.
- Built-in Firewalls: Azure’s built-in firewalls were configured on the VMs to restrict unauthorized access and protect resources from malicious connections. This included fine-tuning firewall rules based on each VM’s service and responsibilities, mitigating the attack surface accessible to bad actors
- Private Endpoints: To boost the security of Azure Key Vault and Azure Storage, public endpoints were replaced with private endpoints. This ensured that these sensitive resources were limited to the virtual network, not the public internet.
- Subnetting: To further enhance security, a subnet was created for Azure Key Vault and Azure Storage, separating traffic and providing an additional layer of protection for those endpoints.
Following these measures, I proceeded to conduct another 24-hour observation for this ‘After’ environment.
Architecture ‘After’ Hardening the Environment

Metrics ‘After’ Hardening
The following table shows the 24-hour metrics generated after hardening the environment: 11/25/2023, 10:41:17 AM → 11/26/2023, 10:41:17 AM
| Metric | Count |
|---|---|
| SecurityEvents (Windows VMs): | 9,061 |
| Syslog (Linux VM): | 1 |
| SecurityAlert (Microsoft Defender for Cloud): | 0 |
| SecurityIncident (Sentinel Incidents): | 0 |
| NSG Inbound Malicious Flows Allowed: | 0 |
Attack Maps ‘After’ Hardening
NOTE: The following maps did not yield any results, indicating the absence of malicious activity instances in the 24 hours following the hardening.
NSG Allowed Malicious Inbound Flows
")
Linux SSH Authentication Failures
")
Windows RDP/SMB Authentication Failures
")
MS SQL Server Authentication Failures
")
Comparing the ‘Before’ and ‘After’ Metrics
| Metric | Count (‘Before’) | Count (‘After’) | Change (%) |
|---|---|---|---|
| SecurityEvents (Windows VMs): | 22,540 | 9,061 | -59.80% |
| Syslog (Linux VM): | 998 | 1 | -99.90% |
| SecurityAlert (Microsoft Defender for Cloud): | 7 | 0 | -100.00% |
| SecurityIncident (Sentinel Incidents): | 152 | 0 | -100.00% |
| NSG Inbound Malicious Flows Allowed: | 2,385 | 0 | -100.00% |
Conclusion
Microsoft Azure was used to establish a mini honeynet. Log Analytics workspace served as the log repository for housing various log sources. Microsoft Sentinel was employed to trigger alerts and generate incidents from these log sources. A set of metrics was utilized to evaluate the environment for 24 hours both before and after hardening. Analyzing the net change in the table above revealed a significant reduction in incidents and security events, demonstrating the effectiveness of the applied security controls.
Credits: This project was based on a course developed by Josh Madakor, which can be found here: leveld. For additional valuable content, don’t miss out on Josh’s YouTube channel: Josh Madakor